Political Payola

Verified Multi-Source Civic Atlas

Nonpartisan Empirical Public Intelligence · 1981–2026
EN | ES
✓ Nonpartisan Charter
INVESTIGATIVE CIVIC LEDGER · 1981 TO PRESENT

Money in politics. Laws on the table. Votes on the record.

Every statistic cross-references peer-reviewed journals (JAMA Network Open, NEJM, AJPM, Presidential Studies Quarterly, Journal of Labor Economics) and nonpartisan research institutions (Pew, KFF, NBER, PIIE, CHDS, Rutgers CAWP, Brown Costs of War) alongside official roll-call records.

5,308
Verified records
26
Validated modules
539
Lawmaker portraits
Top 21
News Outlets Scraped
🗳️

Election Day — November 3, 2026

Midterm polls close today. Every congressional seat, 36 governorships, and 5,800+ state legislature races are on the ballot. Track the money behind every candidate in our Corruption Archive → and see which laws are at stake in our Top 20 Bills Lens →

TOP 20 SCOTUS DECISIONS · 1987–2022
Landmark Supreme Court Rulings That Changed Your Rights ➔
Every justice vote tracked with appointing president. 20 cases across campaign finance, civil rights, criminal justice, and corporate power — with dual-sourced impact metrics.

A. Modern Presidents (Reagan to Now): Vacation & Personal Days Away Per Term

Showing BOTH narrow vacation/personal-residence days (excl. Camp David) AND total days away (incl. Camp David, weekend homes & personal resorts) so neither party can cherry-pick definitions.

# President & Party Term & Years Vacation / Personal Residence Days (Excl. Camp David) Total Days Away (Incl. Camp David / Home Weekends) Camp David Primary Retreats / Properties Multi-Source Verification

B. Top 10 States with Highest Domestic Violence (Intimate Partner Violence) Rates

Multi-Sourced: American Journal of Preventive Medicine (Merrick et al.), UCLA Center for Health Policy Research, CDC NISVS State Reports (2010–2012 & 2016/2017–2024 cohorts), World Population Review & NCADV / Break the Cycle Shelter Audit. Top-10 Party Split: 6 Republican Trifectas, 3 Divided States (won by Trump in 2024), 2 Democratic Trifectas.

Rank State Party Control & 2024 Vote Women Lifetime IPV % Men Lifetime IPV % Combined IPV % NISVS 2016/17 Cohort (Women) Unmet Daily Shelter Requests Sources

C. Top 10 States with Highest Poverty Rates (2024–2025)

Multi-Sourced: U.S. Census Bureau SAIPE / ACS, Columbia University Center on Poverty and Social Policy & KFF. Top-10 Party Split (incl. 10th-place tie): 7 Republican Trifectas, 2 Divided States (won by Trump in 2024: KY, MI), 2 Democratic Trifectas (NM, NY).

Rank State Party Control & 2024 Vote Poverty Rate (All Ages) Year Plain-English Summary Sources

D. Top 10 States for K-12 School Shootings (Raw Incident Count vs. Per-Capita Rate)

Multi-Sourced: Naval Postgraduate School CHDS K-12 School Shooting Database (Riedman 2025/2026), KFF Health Policy Research (Panchal et al.), New England Journal of Medicine (Goldstick et al.), and Gun Violence Archive. Raw counts track population size; per-capita rates highlight high-incidence smaller states.

Rank By Total Incidents (1966–2026) Cumulative & Recent (2013–2025) Rate / 100k By Per-Capita Rate (50 States) Incidents per 100,000 Residents Sources

E. Top 10 States for Mass Shootings (4+ Shot Excluding Shooter — Total vs. Per-Capita Rate)

Multi-Sourced: Peer-reviewed study in JAMA Network Open (Barnard et al. 2023, Univ. of Colorado Injury & Violence Prevention Center, PMC10372703, analyzing 4,011 mass shootings & 21,006 casualties across 2014–2022) + Gun Violence Archive 2024–2026 logs. Per-Capita Top 10 (50 States): 6 Republican Trifectas (LA, MS, AL, MO, SC, TN), 3 Democratic Trifectas (IL, MD, DE), 1 Divided (PA).

Rank By Total Mass Shootings 2014–2022 Total (& 2024 Count / Casualties) Rate / 1M By Per-Capita Rate (per 1M Residents) Rate per Million & Casualties Sources

F. Top 10 States Most Negatively Impacted by Mass Deportation

Multi-Sourced: Pew Research Center (Passel & Krogstad, Aug 2025 state labor force & household tables), American Immigration Council (2024/2025 economic & tax modeling: -4.2% to -6.8% U.S. GDP, $1.1T–$1.7T/yr loss), Peterson Institute for International Economics (PIIE Working Paper 24-20: up to -7.4% GDP & +9.1% inflation), and NBER / Journal of Labor Economics (East et al. 2023).

Rank State Party Control & 2024 Vote % of State Workforce Lost Unauthorized Workers Removed Total Residents & Household Share K-12 Students Impacted Hardest-Hit Industries Sources

A. U.S. Demographics & How America Votes Since Reagan (1980–2024): Race, Gender & Age

Official U.S. Census Bureau population & voter composition paired with Pew Research Center Validated Voters and National Exit Poll two-party splits (Red = Republican % · Blue = Democrat %) across all 12 presidential elections from Ronald Reagan (1980) to 2024.

NON-HISPANIC WHITE SHARE (1980 ➔ 2024)
79.6% ➔ 57.5% of U.S. Pop
Share of voters shifted from 88% (1980) to 71% (2024). Voted 56% R / 36% D in 1980 and 57% R / 41% D in 2024.
HISPANIC / LATINO SHARE (1980 ➔ 2024)
6.4% ➔ 19.5% of U.S. Pop
Share of voters grew 6× from 2% (1980) to 12% (2024). Voted 35% R / 56% D in 1980, 28% R / 66% D in 2016, and surged to 46% R / 52% D in 2024.
BLACK AMERICANS & ASIAN / MULTIRACIAL
12.1% Black · 10.9% Asian/Multi
Black voters voted 14% R / 83% D in 1980, 4% R / 95% D in 2008, and 15% R / 83% D in 2024. Asian voters shifted from 55% R (1992) to 39% R / 58% D (2024).
THE GENDER & AGE GAP (1980 ➔ 2024)
Men 55% R · Women 53% D
Men backed Reagan 55% R / 36% D (1980) and Trump 55% R / 43% D (2024). Young voters 18–29 swung from 66% D (2008) to 54% D / 43% R (2024).
Year & Matchup U.S. Pop & Voter Racial Makeup Vote by Race (R% vs. D%) Vote by Gender (Men / Women) Vote by Age (18–29 / 30–44 / 45–59 / 60+)

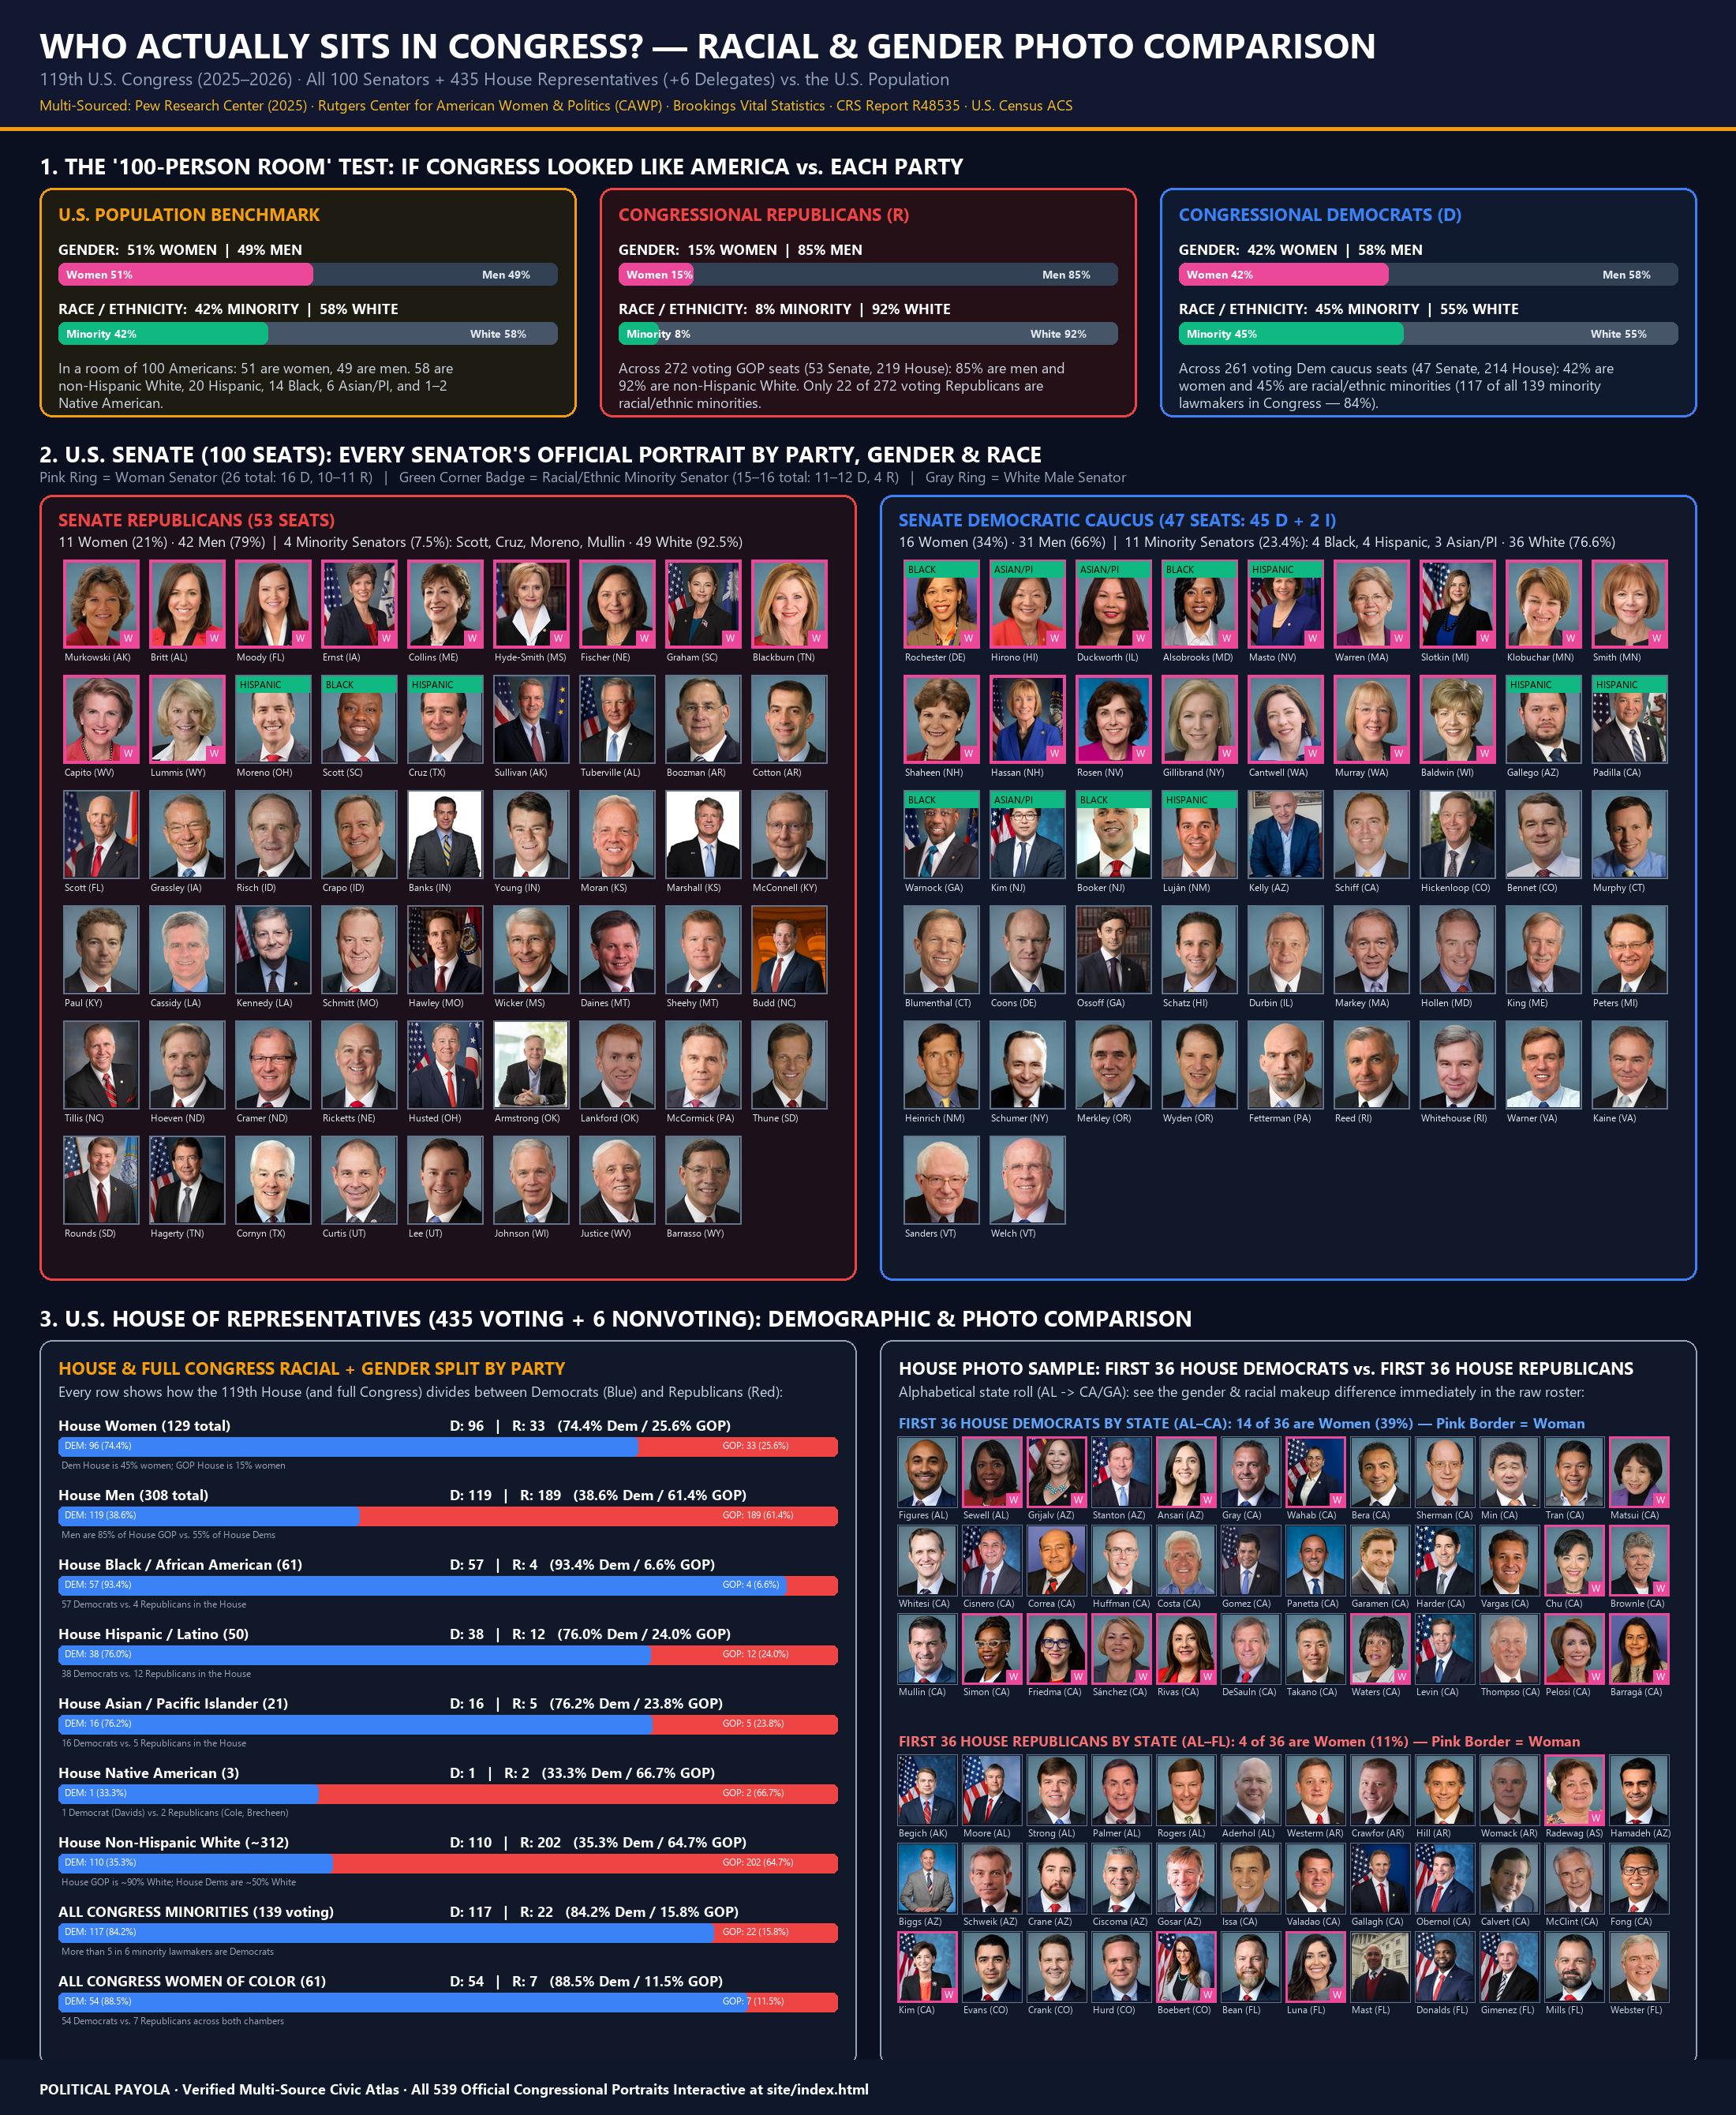
B. 119th U.S. Congress (2025–2026): Racial & Gender Photo Comparison

High-resolution editorial infographic + live filterable photo wall of all 539 official portraits (Senators, House Representatives & Delegates). Sources: Pew Research Center (2025), Rutgers CAWP, Brookings Vital Statistics, CRS Report R48535.

119th Congress Racial and Gender Photo Comparison

50-State Rankings & Party Correlation Explorer

25+ verified metrics ranked across all 50 states. Every data point dual-sourced. Party trifecta control and 2024 presidential vote shown for every state.

A. Active & Past Bills Impacting American Families: Top 10 / Top 20 Lists, Roll-Call Votes & Flowcharts

Plain-English investigative tracker showing active bills in Washington DC right now (119th Congress, 2025–2026) and past landmark laws (1981–2025) that directly impact family paychecks, healthcare, groceries, student loans, bank fees, and retirement. Track who sponsored each bill, how Republicans and Democrats voted, and how your own local Representatives and Senators voted.

Simple Visual Flowcharts: How a Washington Bill Hits Your Community, Household & Paycheck

Click any pathway below to trace how Congress & donor money affect your kitchen table:

Check Your Local Politicians: Who Represents Your State, Who Funds Them & How Their Party Votes

Select your state to see your 2 U.S. Senators and House Representatives, their party, whether they rank in the Top 25 for corporate/PAC money, and how their party caucus voted on the family bills below.

CITIZEN ACTION & MOVEMENT CENTER

Galvanize for Real Change: Petitions, Numbers & Direct Representative Contact

When enough voters galvanize behind verifiable facts, policy shifts. Use this platform to hold lawmakers accountable: contact your representatives directly regarding upcoming legislation, sign verified citizen petitions on healthcare and cost-of-living, or launch a grassroots community action initiative.

Contact Your Representatives
HEALTHCARE ACCESS 18,420 Signatures

Protect Medicaid Funding & Cap Prescription Drug Costs

Petition Congress to reject federal Medicaid block grants and protect the $2,000 yearly Medicare drug cap.

CONSUMER BANKING 14,195 Signatures

Enforce the $5 Overdraft Fee Cap on Megabanks

Directly petition the Senate Banking Committee to uphold CFPB caps saving American families $5B annually.

CAMPAIGN REFORM 22,810 Signatures

End Dark Money & Unlimited Corporate Committee Cash

Require instant 24-hour donor disclosure for all PAC contributions over $1,000 on federal elections.

B. 36 Landmark Federal Laws Since 1981: What They Did, Who Voted Yea/Nay & CBO Cost

Every major tax, healthcare, crime, trade, financial, infrastructure, and reconciliation bill from Ronald Reagan's 1981 tax cut to the 2025 reconciliation act.

⚖️

Supreme Court Decisions That Reshaped Your Rights

20 landmark rulings from 1987–2022: every justice vote tracked, every impact number dual-sourced, written at a 10th-grade reading level. From Citizens United to Miranda rights.

Explore the Top 20 SCOTUS Lens →

A. Prolific Political Corruption Archive (1980–2026): Federal & State Senators, Congressmen & Governors

Interactive, primary-source verified catalog of 177 modern political corruption cases (93 Democrats · 84 Republicans · 12 Colorado cases) across federal and state levels — covering indictments, arrests, convictions, expulsions, censures, campaign finance fraud, bribery, and sexual misconduct. Click any case to inspect full crime details, sentences, official DOJ/Ethics dockets, and contemporary newspaper clippings.

Full Chronological Corruption Ledger Table (1980–2026) — Click Any Row for Newspaper Clippings & Court Dockets
Year Official & Party Level & Chamber Category Legal Status & Sentence Newspaper Clippings & Official Docket

B. Top 25 Politicians Receiving the Most Donor / Corporate (PAC) Money — 2024 Cycle

Official FEC figures for "other political committee contributions" (PAC, corporate & trade-association committees) to each member of Congress, ranked highest-to-lowest, with each lawmaker's party. Sorted by total PAC/committee dollars received in the 2024 election cycle. Party split in the Top 25: 13 Republicans, 11 Democrats, 1 Independent.

# Lawmaker & Party Chamber PAC / Corporate Money % of Total Raised Total Receipts FEC Record

Major Corruption Scandals & Congressional Convictions / Censures

Top-20 Unions: Federal PAC Contributions (D vs. R) & Endorsements

Union & Metric Cycle Amount / Endorsement Plain-English Summary Sources

Top 21 News Outlets: Political Lean, Scraped Output & 10th-Grade Voter-Impact Radar

Instant visual guide to America's Top 20 digital, print newspaper, cable TV, broadcast TV, public radio, wire service & magazine outlets — showing whether their output leans Democrat/Left, Center, or Republican/Right, backed by live scraped headlines and Pew Research, AllSides & Ad Fontes benchmarks.
INTERACTIVE IDEOLOGICAL SPECTRUM · CLICK ANY OUTLET PILL TO INSPECT

At-a-Glance Political Lean Meter (Purely Output-Based: -100 Left/Democrat to +100 Right/Republican)

◀ LEANS DEMOCRAT / LIBERAL (-100 to -15) NONPARTISAN CENTER / WIRE (-14 to +14) LEANS REPUBLICAN / CONSERVATIVE (+15 to +100) ▶
Showing 21 of 21 outlets

Complete Top 21 News Outlets Verification Matrix (Click Any Row for Live Scraped Headlines & Voter Translation)

Rank & Outlet Medium (Digital / Hard Copy) Political Lean & Party Alignment Factual Score & Benchmarks 10th-Grade Voter-Impact Translation & Live Output Verified Sources
POLITICAL PAYOLA PRO · CAMPAIGN WAR-ROOM, WEBMCP API & RESEARCH DESK

Turn 5,111 Primary-Source Receipts Into Instant Campaign, Union & Newsroom Firepower.

Corporate PACs spent over $4.2 Billion lobbying Congress this cycle. Political Payola takes $0 from politicians or corporate lobbyists. Every statistic links 1:1 to official FEC.gov committee filings, Congress.gov roll-call votes, CBO cost scores, and peer-reviewed journals (JAMA, NEJM, KFF, NBER) — giving campaigns, unions, journalists, and citizens station-legal proof in seconds.

100% FEC-Compliant Direct Data & Research
All memberships, API keys, widget licenses, and custom research dossiers are direct software & publication purchases from Political Payola (zero candidate conduit fees under 11 CFR § 110.6).
LANE 01 · READER & INSIDER

Unbought & Ad-Free Supporter Pass

$10/month

Keep all 5,111 civic records free from corporate lobbyist ads and unlock The Payola Ledger weekly roll-call & dark-money insider briefing.

  • Weekly "Who Got Paid & How They Voted" insider email digest
  • Downloadable 1-page printable district & state scorecards
  • Early access to quarterly FEC PAC & dark-money updates
  • 100% independent — zero corporate or candidate sponsors
Become a Supporter ($10/mo) ➔
LANE 03 · AGENCIES, UNIONS & NEWSROOMS

War-Room Agency & White-Label Widgets

$499/month

For political consulting firms, labor unions (SEIU, NEA, AFT, IBEW, IAFF, AFSCME), and newsrooms embedding live scorecards.

  • White-label PDF & slide opposition briefs for up to 5 team seats
  • Embeddable <iframe> Union Legislative Scorecards & 50-State Maps
  • Bilingual (EN/ES) toggle & custom organization branding
  • Unlimited WebMCP API queries + real-time FEC filing webhooks
Launch War-Room License ($499/mo) ➔
LANE 04 · TURNKEY BROADCAST LEGAL BACKUP

Custom Station-Legal TV Ad & District Dossier

$1,500/dossier

Every TV and streaming attack ad requires a line-by-line primary-source backup binder for station legal clearance. We deliver it in 48 hours.

  • 15–25 page citation-locked District Impact & Opposition Dossier
  • Every claim pinned to FEC committee IDs, roll-call votes & CBO/JAMA
  • Formatted for broadcast TV legal clearance & debate prep binders
  • Includes custom Kitchen-Table Cost impact breakdown for your district
Order Custom Dossier ($1,500) ➔
WHITE-LABEL EMBED PREVIEW · UNIONS, ADVOCACY & MEDIA

Embed Live 50-State Rankings & PAC Scorecards on Your Site

Drop our bilingual (EN/ES), citation-locked civic modules directly into your union portal, campaign site, or local newsroom article with one line of HTML:

<iframe src="https://politicalpayola.com/?embed=top25-pac&lang=en" width="100%" height="540" style="border:1px solid #cbd5e1;border-radius:8px;" title="Political Payola Verified PAC & Roll-Call Scorecard"></iframe>
THE PAYOLA LEDGER · WEEKLY BRIEFING & VOTER ACTION ALERTS

Get "Who Got Paid & How They Voted" Every Week

Join Capitol Hill staffers, union organizers, journalists, and voters receiving our weekly breakdown of the Top 3 Kitchen-Table Bills & PAC Money Flows — or inquire about B2B newsletter sponsorships and civic-tech foundation grants.

INSTITUTIONAL GRANT READINESS · 501(C)(3) PUBLIC-INTEREST & NONPARTISAN CHARTER

Foundation Grants, Open-Data Provenance, Classroom Curriculum & Rural Colorado Equity

Political Payola is engineered from the ground up to meet the institutional standards of the Knight Foundation, Democracy Fund, Hewlett Foundation, Mozilla Data Futures Lab, and Colorado Media Project. 100% of philanthropic grant funding and civic donations are strictly ring-fenced for free, nonpartisan bilingual (EN/ES) voter literacy, Title I high school civics curriculum, and rural Colorado data coverage.

CC-BY-4.0
Open Academic & Classroom License
100% EN/ES
Bilingual Grade-10 Parity
WCAG 2.1 AA
Low-Vision & 3G Rural Ready
24-Hr SLA
Public Right-of-Reply Log
1 · INN NONPARTISAN CHARTER & FIREWALL

Equal-Standard Audit & Public Corrections Log

All 50 states (27 R, 23 D) and all 539 members of the 119th Congress are evaluated with identical mathematical formulas. No donor, foundation, union, or subscriber may alter or suppress any dataset.

Submit a Primary-Source Correction (24-Hr SLA)
2 · YOUTH CIVICS & TITLE I CLASSROOM KIT

Free High School & College Civics Curriculum (EN/ES)

Three turnkey, 45-minute nonpartisan classroom labs teaching students how to trace a bill on Congress.gov, audit campaign PAC filings on FEC.gov, and verify state health rankings in JAMA & KFF.

  • Lab 1: How a Federal Bill Becomes a Family Cost (CBO)
  • Lab 2: Auditing Your District's FEC PAC Filings
  • Lab 3: Peer-Reviewed Data vs. Political Spin (EN/ES)
Download Free Educator Lesson Kit (EN/ES) ↗
3 · SOUTHERN & RURAL COLORADO SPOTLIGHT

Colorado 64-County & CO-03 Rural Impact Tracker

Homed in Pueblo, Colorado, Political Payola tracks how federal Medicaid rules, rural hospital funding, SNAP/agriculture bills, and water/wildfire appropriations impact Pueblo, Huerfano, Las Animas, Otero, Fremont, Custer & El Paso Counties.

  • Bilingual Spanish/English parity for Southern CO families
  • Zero-dependency fast load (<1.2s) for rural 3G/satellite households
  • Free embeddable widgets for Colorado local newsrooms
🏛️

Support This Project

Political Payola is a nonpartisan civic atlas built and maintained by one team with zero outside funding. Every impact number is dual-sourced — no advocacy, no donor influence, just the receipts. Read our Methodology, Ethics Policy, and 501(c)(3) Compliance.

To support this work or discuss partnership and grant opportunities: GitHub (open data) · Cite This Project · Impact & Evaluation